
Analyze Every Run
Like a Pro
Click on any slope to unlock a treasure trove of data. We give you all the information you need to decide if a run is right for you.
Instant Slope Intelligence
See the slope's name, its mapped difficulty, and the Bonvo score out of 10 where data is available. You can also share a direct link to this specific slope with your friends!
Slope Rating
Bonvo's data-derived 1–10 scoring system
Official Difficulty
Trail-map colour: green, blue, red, black or orange
Share Direct Links
Send specific slopes to your friends

The Interactive Elevation Profile
Below the scorecard, you'll find a detailed elevation profile. The horizontal axis shows the length of the run, and the vertical axis shows the altitude.
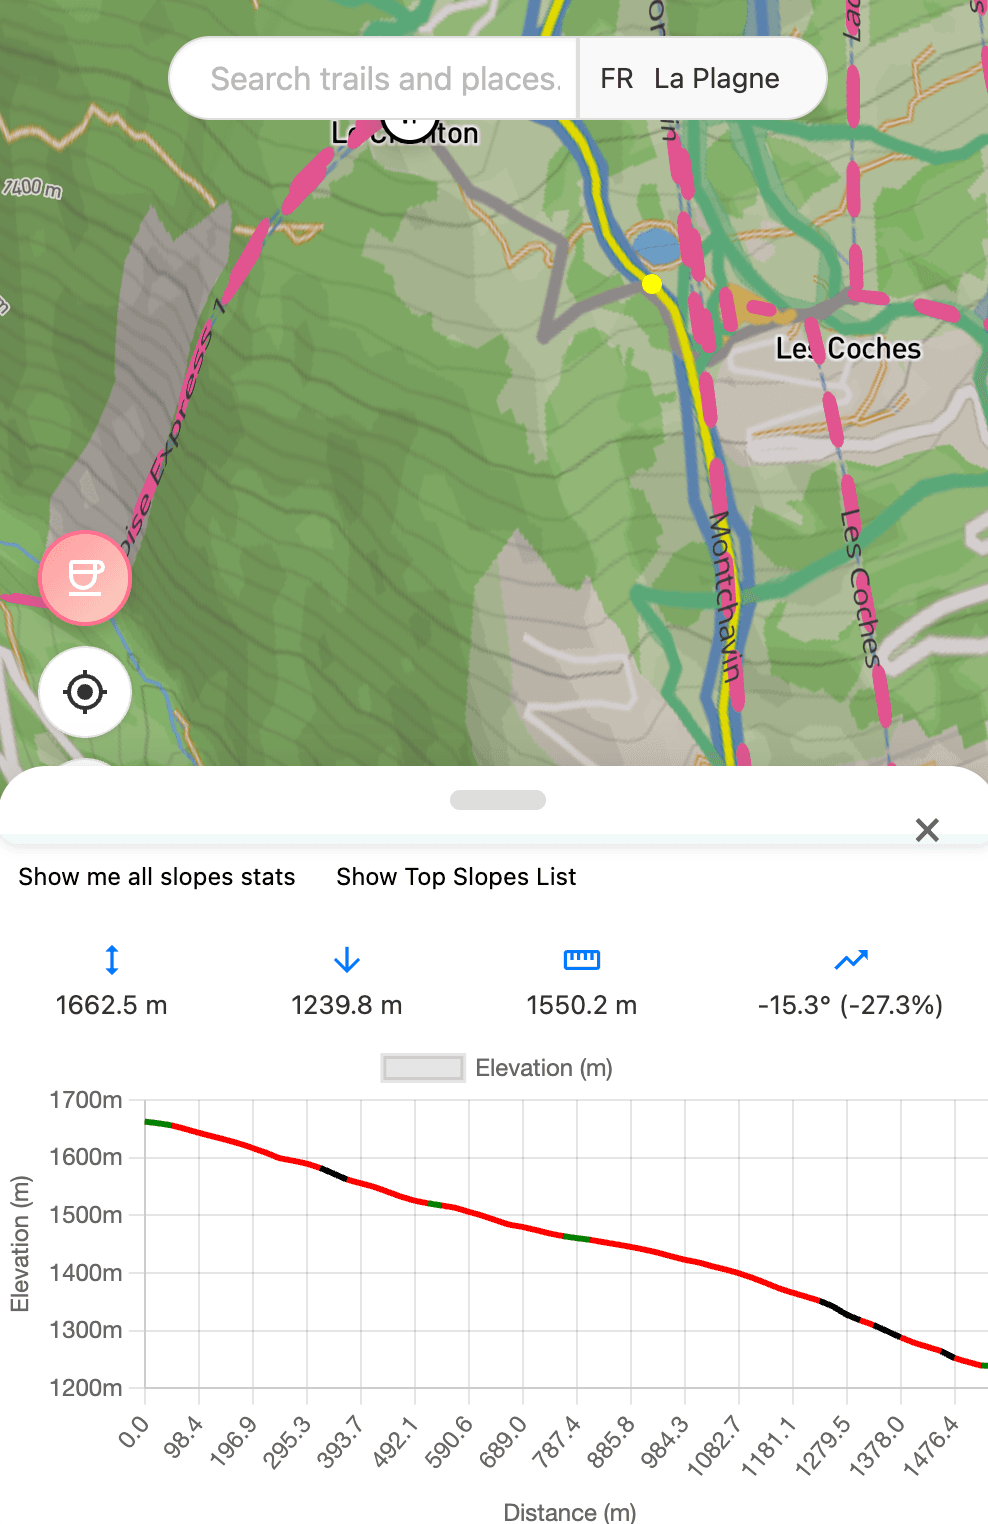
Hover to Explore
Hover your mouse along the graph, and a dot will show you the exact position on the 3D map! See the steep sections (colored red) and the gentler parts before you ski them.
Highlighted in red for advanced skiers
Perfect for beginners and cruising
A dot shows your position on both graph and map
Pro Tip
This visual helps explain the slope analysis: the elevation graph and 3D map can be read together to understand the available mapped terrain data.
Focus on What Matters
When you select a slope, it's highlighted in yellow so you can focus on it. When you're done, simply click the 'X' or click away from the slope to return to the full resort view.
Click Any Slope
Slope gets highlighted in yellow for focus
Analyze the Data
Review scorecard and elevation profile
Close & Continue
Click 'X' or click away to explore more slopes
Ready to Analyze Your Next Run?
Get detailed insights on every slope before you ski. Make informed decisions and ski with confidence.
Frequently Asked Questions
What data does Bonvo Ski slope analysis show?▼
Tap any slope to see its official difficulty rating, a 1-10 Bonvo score, total length, elevation drop, an interactive elevation profile showing steepness color-coded in real time, and a snowboard-friendliness score.
How is the snowboard-friendliness score calculated?▼
The score analyzes the full elevation profile of each run, identifying flat sections and uphill segments that are problematic for snowboarders. Runs with minimal flat spots and consistent downhill grade score higher.
Can I share slope data with friends?▼
Yes. Each slope has a share button that generates a direct link. Send it to friends so they can see the same analysis and plan runs together.